How to view summarized reports of your clients or team members?
Know all about viewing summarized reports of your clients or team members
Navigating and viewing summary reports
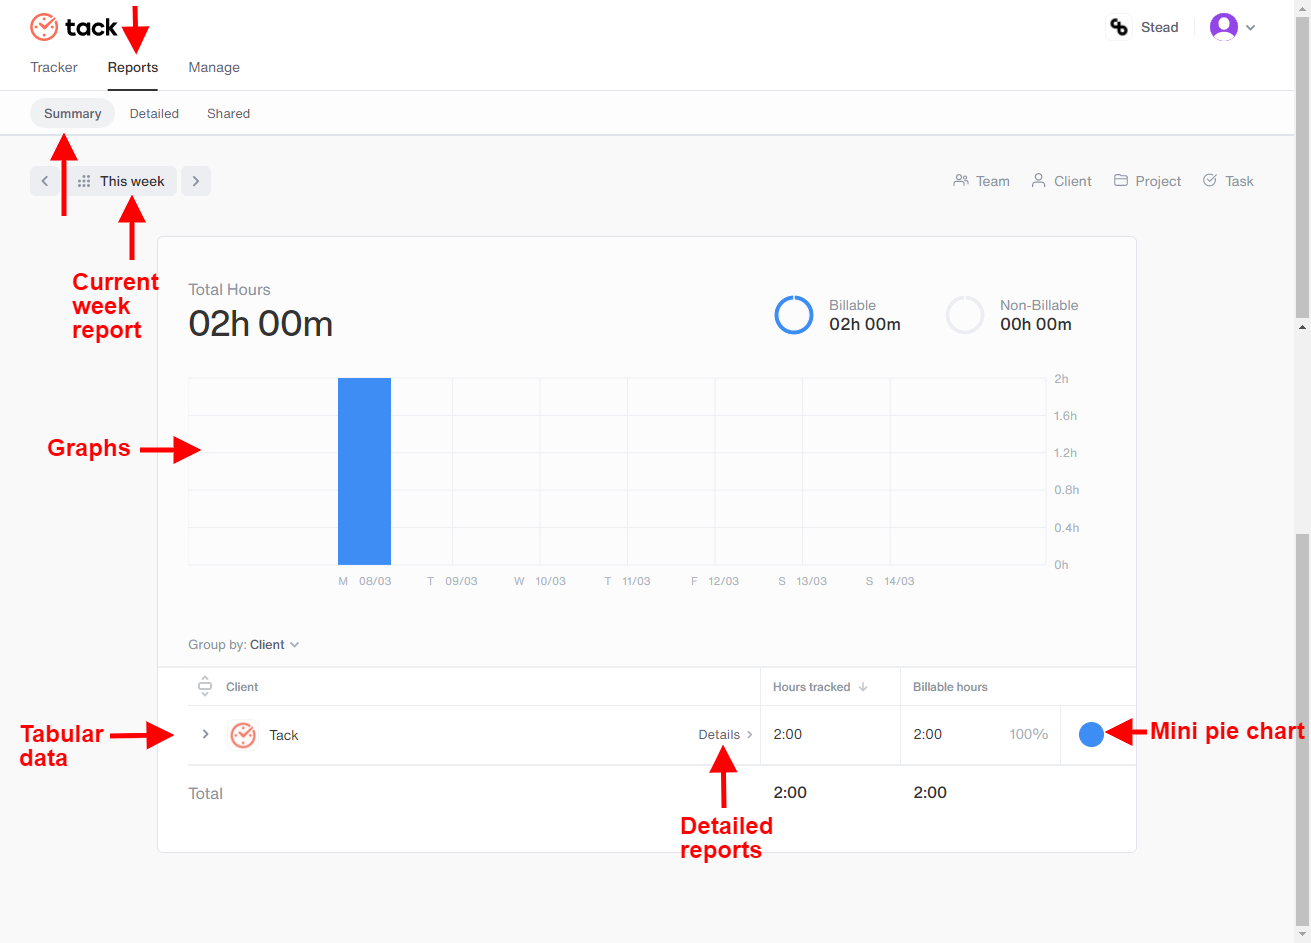
Click on Reports followed by the Summary option on the next page.
By default on the summary reports page the current week’s data will be displayed, total hours are segregated into billable and non-billable hours and are mentioned in numbers as well as the dual-colored graphs.
Right below the graph, depending on the Group by option a tabular column is present consisting of team member’s/project/task/client names, total hours tracked, billable hours, percentage of billable hours, and mini pie charts of the time tracked hours.
A detailed report of team member/project/client/tasks
Depending on the Group-by option, hover the mouse cursor on any team member name/project name/task name/client name and click on the details option that appears on the left-hand side of hours tracked you will be directed to the detailed reports page which will display elaborated reports of the respective client/project/tasks/team members. Want to know more about the Detailed time report?
Note: Hover your mouse cursor on the percentage value and it will display a small pop-up with the percentage of billable hours.
Group by your data
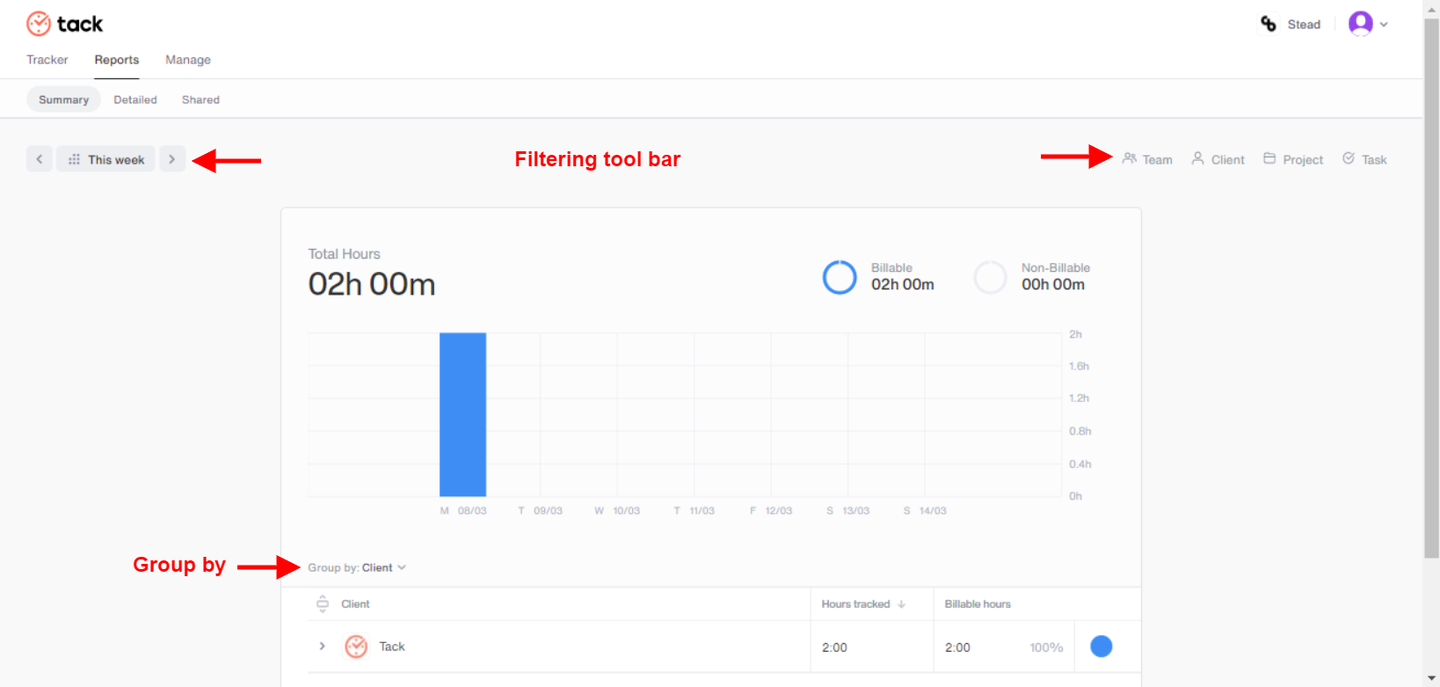
- Various Group by options: To access this option click on the ' v ‘
button next to the Group by option word and a drop-down menu with three
options is given Client, Project, Team, and Task choose how you want to
group by your data.
- Group by: Client - This option groups the data giving preference to the client name and segregates the columns as Client, Hours tracked, and Billable Hours.
- Group by: Project - This option groups the data giving preference to the project titles and segregates the columns as Project name, Hours tracked, and Billable Hours.
- Group by: Team - This option groups the data giving preference to the team member’s names and segregates the columns as Members, Hours tracked, and Billable Hours.
- Group by: Task - This option groups the data giving preference to the task titles and segregates the columns as Task name, Hours tracked, and Billable Hours.
Filtering a particular summary report
- Filtering Dates- By default, the Detailed reports page displays the current week’s data. Click on the This week button and you can choose your desired dates from the calendar displayed.
- Filtering team members- If you choose to share detailed reports of particular team members click on the ‘Team’ option present on the right-hand side of the screen and choose single or multiple team members from the list.
- Filtering clients- If you choose to share detailed reports to a particular client, click on the Client option present on the right-hand side of the screen and choose a single client from the list. (Multiple clients can be chosen for your reference).
- Filtering Projects & Tasks- Click on either the projects or tasks option present on the right-hand side of the screen and choose from the list according to your invoice needs.
Note: Filter reports according to your preference to refer to your data accurately.
Collapse or Expand data
- Depending on the type of Group by option, click on the icon right under the Group by word to expand the summary data or collapsed data. By default the data is collapsed, you can also click on the '>' on the left-hand side of the task/project/team member/client name to expand the particular data.
Ascending/Descending report data
- Depending on the Group by option click on the column names such as Client or Hours tracked or Billable hours and data will rearrange accordingly, notice the up arrow ⬆️ (ascending order) and down arrow ⬇️ (descending order).